

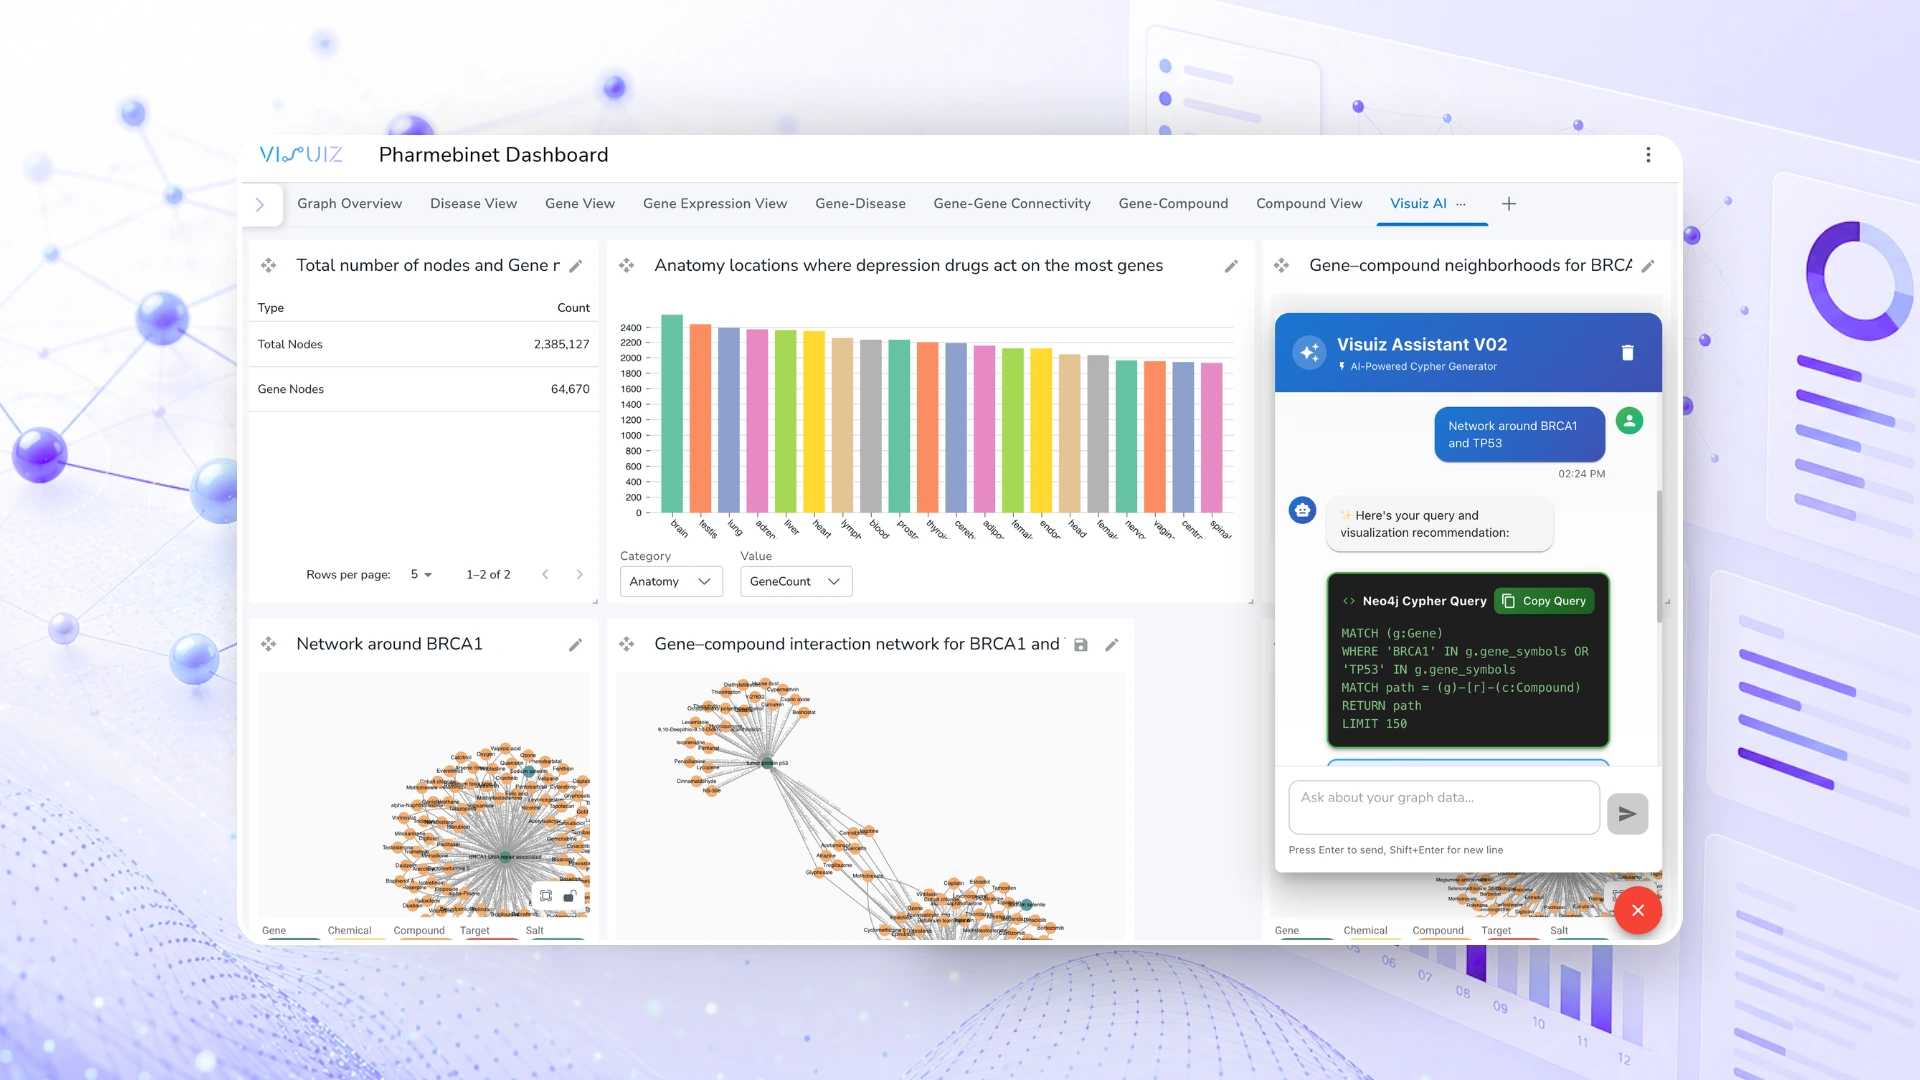


Visuiz Overview
Visuiz is an AI-powered graph data visualization and analytics platform designed to help professionals transform complex, interconnected datasets into clear and actionable insights. The platform enables users to explore relationships, identify patterns, and understand complex data structures through interactive visualizations and intelligent analysis.
Modern organizations generate massive volumes of connected data across multiple sources. However, extracting meaningful insights from complex relationships between entities remains challenging using traditional analytics tools. Visuiz addresses this challenge by combining advanced graph visualization, AI-powered analytics, and natural language interaction to simplify complex data exploration.
With its intelligent AI Chat capability, users can describe their requirements using natural language, and Visuiz automatically understands the request, analyzes the available data, and generates relevant graph visualizations. This removes the dependency on complex queries and technical expertise, allowing both technical and non-technical users to explore data more efficiently.
Designed for data scientists, healthcare researchers, IT teams, cybersecurity professionals, and enterprise organizations, Visuiz provides a powerful environment to discover hidden relationships, detect anomalies, and accelerate data-driven decision-making.
Problem
Organizations dealing with graph data encounter multiple challenges that slow productivity and limit insight:
- Complex Data Structures
- Fragmented Visualization Tools
- Time Consuming Analysis
- Security and Access Challenges
- Operational Inefficiencies
Graph datasets may contain a million nodes connected by edges. That is complex data. The complexity left behind incomplete and misleading analysis done with generic BI tools.
Many tools focus on an individual data point and overlook the relationships. Because of this, visualizations have less value.
Examining relationships in the database can take days, or sometimes even hours. They create charts while writing queries to pull the related data. This slows overall decision making.
Using different tools causes operational inadequacies that stop cooperation between teams and departments. It becomes difficult to have one source of truth which causes slow alignment in the organization.
The need for graphical data analysis problems throws light on the solution requirement which can provide security and scalability. Visuiz meets this need effectively.
These challenges highlighted the need for a solution that simplifies graph data analysis while maintaining security, scalability, and collaboration. Visuiz meets this need effectively.
Solution
Visuiz transforms complex graph data into understandable visual intelligence through AI-powered exploration and interactive analytics.
- AI-Powered Natural Language Graph Exploration
- Simplified Data Understanding
- Accelerated Decision Making
- Collaborative Data Exploration
- Secure and Scalable Architecture
- Flexible Deployment Options
Users can describe their requirements through conversational AI, and Visuiz automatically generates relevant graph visualizations based on their requests.
Complex relationships and large datasets are converted into interactive visual experiences, allowing users to discover connections without requiring advanced technical skills.
AI-powered analysis identifies patterns, anomalies, clusters, and important relationships to help users make faster and more informed decisions.
Centralized dashboards and shared visualizations enable teams to collaborate and work from a common understanding of data insights.
Designed with enterprise-grade security and scalable infrastructure to support large datasets while protecting sensitive information.
Supports different deployment approaches, including cloud-based and organizational infrastructure requirements.
By combining AI, visualization, and advanced graph analytics, Visuiz enables organizations to turn complex data relationships into actionable intelligence.
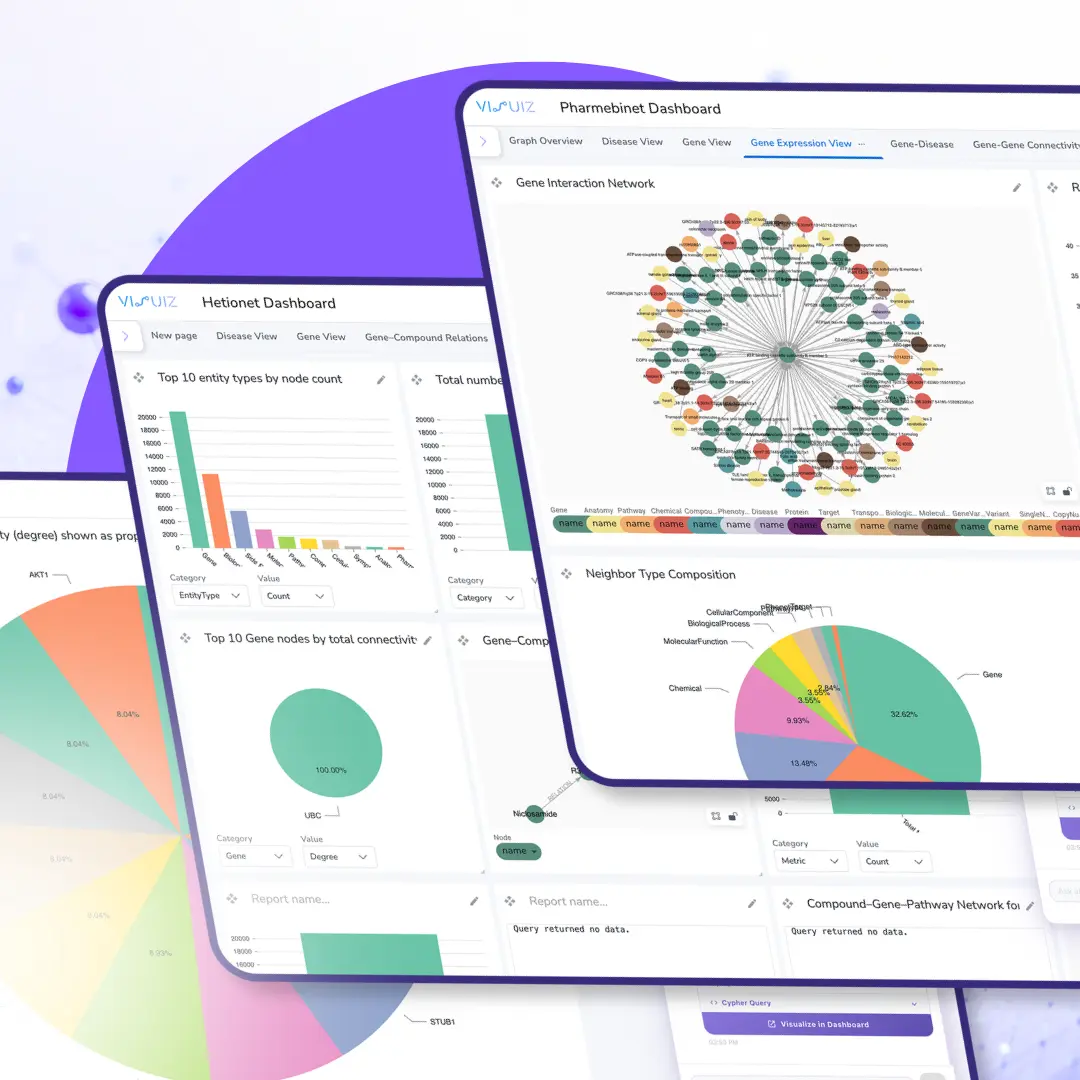
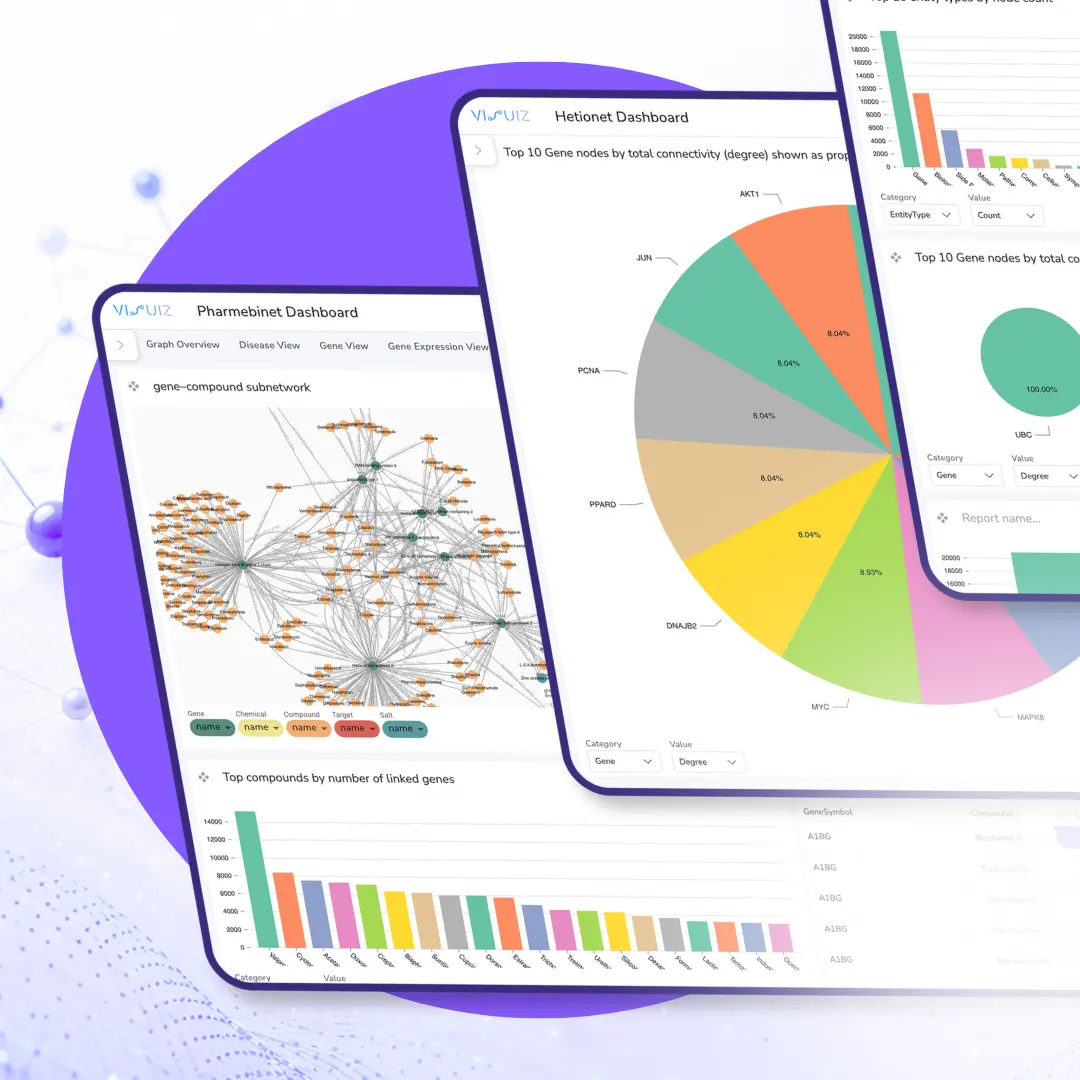
Why It Stands Out
- AI-Powered Natural Language Interaction
- Relationship-Focused Intelligence
- Accessible for Technical and Non-Technical Users
- Faster Insight Discovery
- Enterprise-Ready Scalability and Security
- Transforming Data Complexity into Clarity
Users can explore complex datasets by simply describing what they need, eliminating the complexity of manual queries and technical workflows.
Unlike traditional BI tools that focus mainly on individual data points, Visuiz reveals how information is connected and how relationships influence outcomes.
The intuitive interface allows professionals from different domains to analyze complex data without requiring specialized graph expertise.
AI-driven analysis and automated visualization reduce the time required to identify patterns and make decisions.
Built to handle large-scale datasets while maintaining performance, security, and controlled access.
Visuiz enables organizations to move beyond raw data and uncover meaningful insights that drive innovation and operational improvement.
Ultimately, Visuiz enables professionals to transform complex graph data into clarity, insight, and actionable intelligence, creating measurable business impacts.
Strategy and Approach
- Understanding Professional Data Challenges
- Designing for Simplicity and Accessibility
- Integrating AI for Smarter Exploration
- Ensuring Performance and Accuracy
- Building for Enterprise Growth
- Secure and Collaborative Intelligence
The platform was designed based on the needs of data scientists, healthcare researchers, IT specialists, and cybersecurity teams working with complex relationship-based information.
The user experience focuses on reducing technical barriers by combining intuitive visualization with AI-powered natural language interaction.
AI capabilities were incorporated to understand user requirements, generate relevant visualizations, and identify valuable insights automatically.
High-performance graph processing and analytics engines enable fast exploration of large datasets while maintaining accurate results.
The architecture supports increasing data volumes, users, and organizational requirements while maintaining scalability and reliability.
Security controls and centralized management capabilities ensure teams can collaborate effectively while maintaining data protection.
With this structured approach, Visuiz delivers a powerful, easy to use platform that converts complex data into actionable intelligence for professionals worldwide.
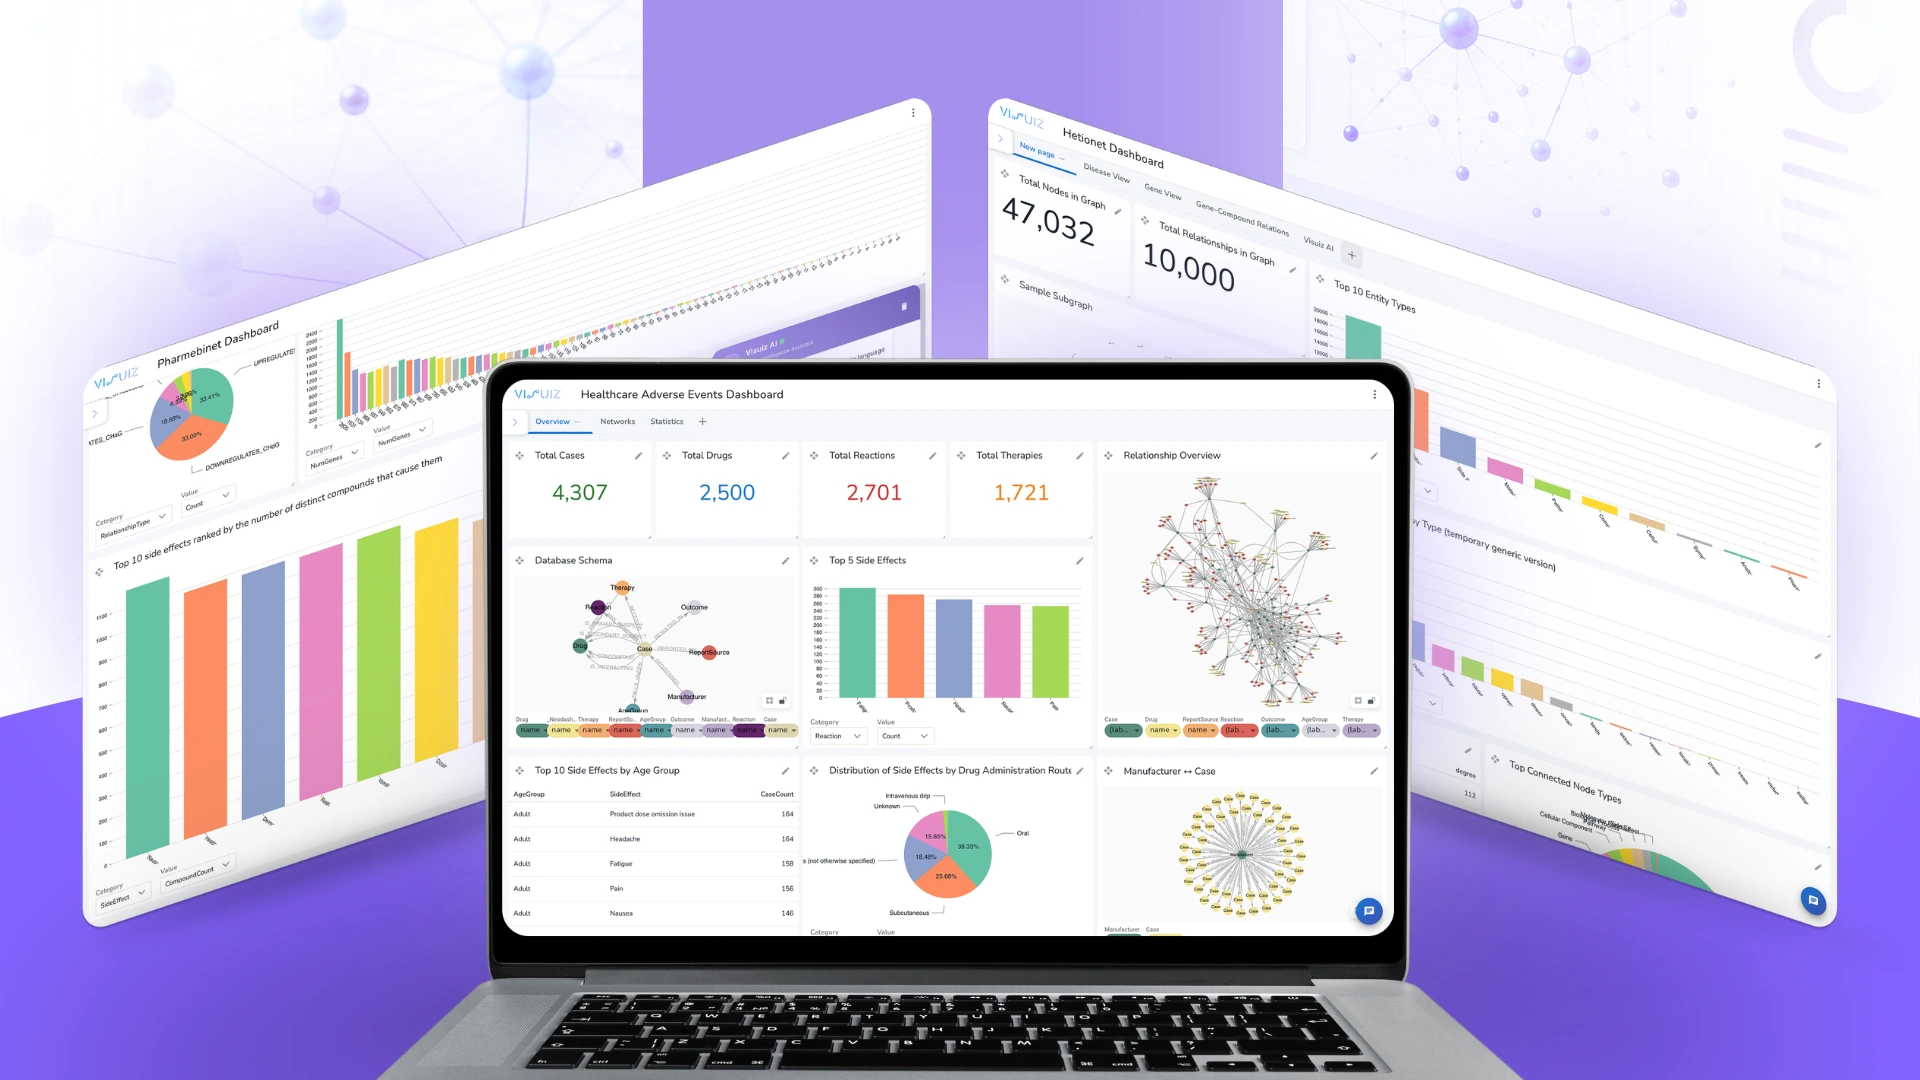
Core Features
- AI Chat-Based Graph Generation
- Advanced Network Visualization
- AI-Powered Analytics
- High-Performance Graph Processing
- Enterprise-Grade Security
- Flexible Deployment Options
- Centralized Dashboards and Collaboration
- Proactive Risk and Relationship Analysis
Users can communicate requirements using natural language, allowing the AI assistant to understand requests and automatically generate relevant graph explorations.
Interactive graphs display nodes, edges, and relationships clearly. Users can filter, navigate, zoom, and explore large datasets to uncover hidden connections.
Automatically detects patterns, anomalies, clusters, and significant relationships, reducing manual analysis effort.
Processes large-scale datasets containing millions of nodes and relationships while maintaining smooth and responsive visualization performance.
Provides user management, access controls, and secure data handling to protect sensitive organizational information.
Supports cloud and on-premise deployment models to meet different infrastructure and compliance requirements.
Allows teams to manage visualizations, share insights, and collaborate through a unified analytics environment.
Helps organizations identify hidden risks, dependencies, and opportunities through relationship-based intelligence.
your project into a success story.